July 24, 2015
Medicare’s Itsy Bitsy Teenie Weenie Yellow Polka Dot Bikini
Statistics are like bikinis.
What they reveal is suggestive, but what they conceal is vital.
–Aaron Levenstein
In its Annual Data Book released last week, the Medicare Payment Advisory Commission (MedPAC) once again put medical imaging—and particularly CT and MR—squarely back in its crosshairs. MedPAC is the influential nonpartisan legislative branch agency charged with providing Congress policy advice on the Medicare program. So, when MedPAC speaks, people listen.
In this year’s report, MedPAC states that “the number of CT and MRI scans per 1,000 fee-for-service beneficiaries grew rapidly from 2000 to 2012” and that “there was minimal change from 2012 to 2013.” Their not so subtle narrative is this: imaging has been growing out of control for over a decade, and things aren’t getting any better. Their accompanying graphic would have readers believe that this is indeed the case. What a jump!
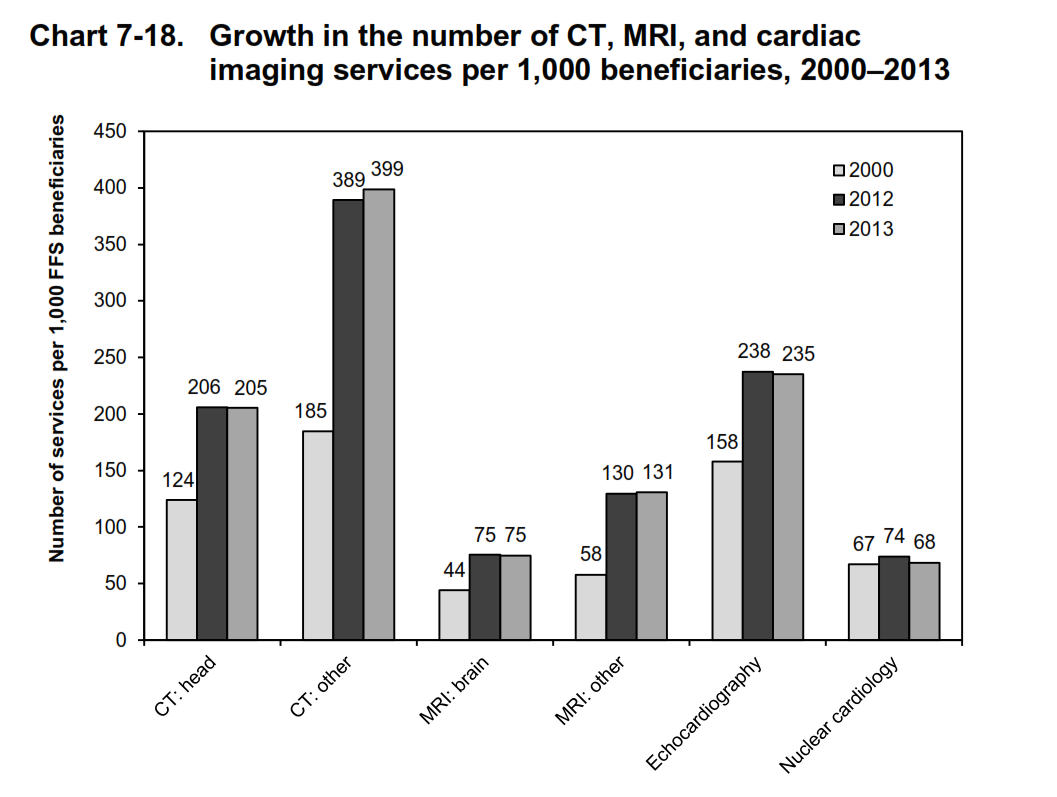
Look more carefully, though. Those selected bars conceal 11 years of intervening data with important policy implications. Below is what our research team at the Neiman Health Policy Institute found when we looked at this more closely. Yes, imaging utilization is up from 2000, But it peaked several years ago, and is now holding stable (CT) or continuing to decline (MR).
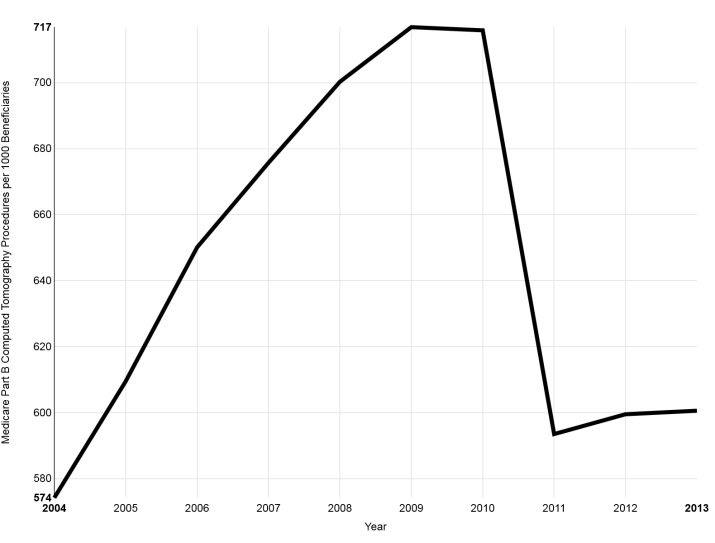
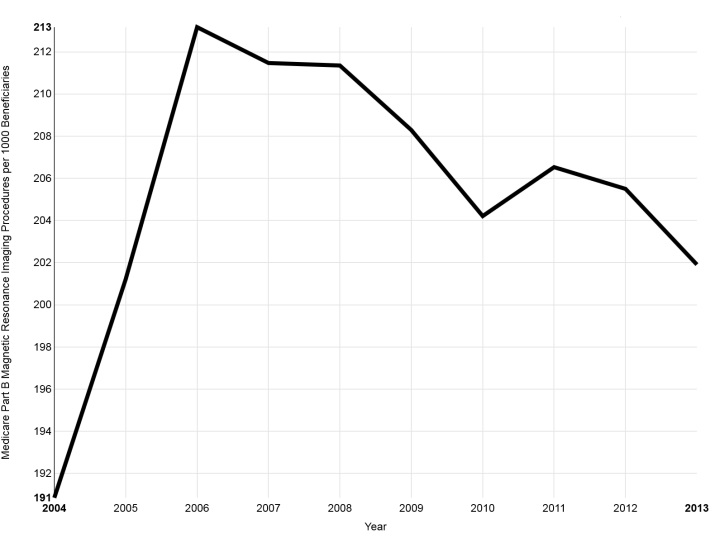
So, MedPAC’s bikini narrative about imaging conceals an important observation for policy making: the sharp downturn in recent years. Take a spin of our interactive Neiman Almanac data tool and see for yourself.
This downturn, by the way, is not news. In fact, it’s the focus of our very first policy brief when we launched the Neiman Health Policy Institute 3 years ago. It’s been described in peer-reviewed publications by our team alone and with David Lee—and in independent studies by Lee and Levin. The reasons for this downturn are many (detailed in those manuscripts), but align with the American College of Radiology’s Imaging 3.0 initiatives to improve communication, carefully consider cost and radiation dose, and pursue real-time clinical decision support tools.
One of the reasons we launched the Neiman Health Policy Institute was to be radiology’s source of “credible and reproducible data and analyses that are currently unavailable.” Our team has worked hard toward that goal (along with many others), obtaining, packaging, and updating data from authoritative sources into the interactive Neiman Almanac. Why, for example, is per beneficiary Medicare utilization over 5 times higher in Florida than Ohio? We need data tools like this to ask such questions—and then seek meaningful answers.
“Right sizing” our healthcare system is a daunting task. We’ve all got our work cut out for us. But, if MedPAC’s report is concealing important information about radiology, what else is it concealing about other physicians, hospitals, payers, and patients?
If we’re going to have a serious discussion about what we need to do to improve our country’s healthcare delivery system, then it’s time we impose a proper dress code for work. Let’s leave our swimsuits at the beach.