ICE-T Inpatient Cost Evaluation Tool
Comparing DRGs
The “Compare A DRG” tool lets users compare up to four inpatient DRG components using several years of nationally aggregated Medicare Part A and Part B data. Users can compare DRGs on several metrics, including cost type, year, and data source. The tool allows users to mix-and-match the metrics for DRGS, such as comparing the imaging cost for a DRG with the imaging share of cost for a DRG, or comparing the imaging costs for a DRG across years. It also includes a legend and a table view of the data. To access the tool, click on the “Browse All DRGs” link in the right-hand box on the home page.
To access the tool, click on the “Browse All DRGs” box on the home page, or the “Compare” link in the navigation bar.
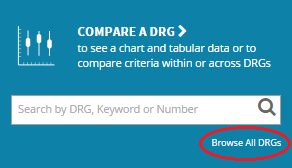
If you know the precise DRG code you are looking for, e.g. DRG 470, you can enter it directly into the search field. You can also enter a search phrase, such as “joint replacement”. When you click on “Browse All DRGs”, the following screen will pop-up. Otherwise, the link will take you directly to the DRG Comparison tool.
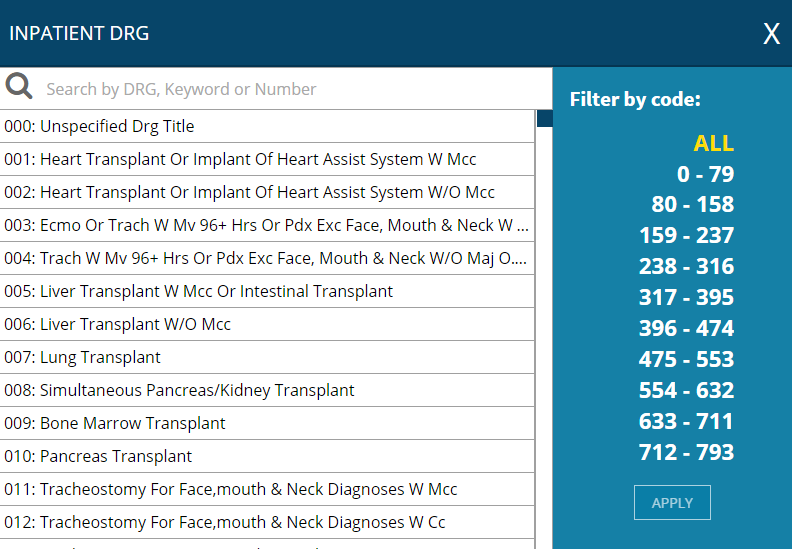
The default view in the pop-up box is to see all DRG codes. If you know the range of DRGs you are looking for, you can select a subset of DRGs by clicking on a subgroup. For example, click on “0-79”. You can also enter a keyword, such as a body part or procedure type, into the search field. Let’s look for DRG Code 069.
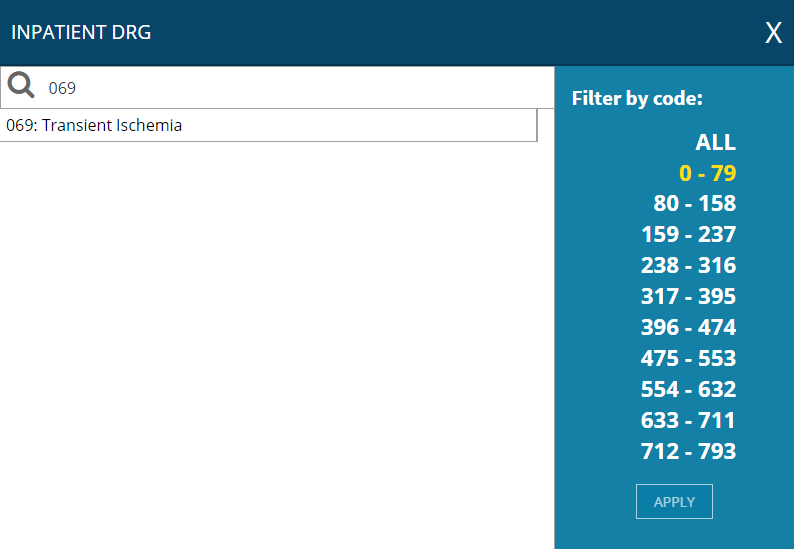
As you can see, “069: Transient Ischemia” is now the only DRG in the list. Click on the DRG code and then click on “Apply” in the bottom right-hand of the box. You will be taken to the “DRG Comparison” chart.
![[A4] Compare 069](http://www.neimanhpi.org/wp-content/uploads/2016/03/A4-Compare-069.png)
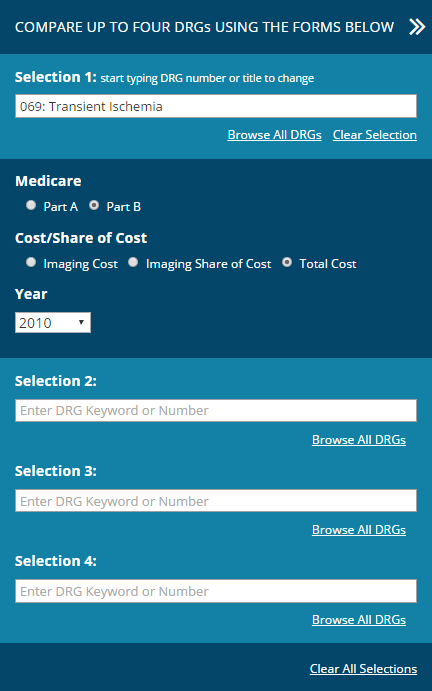
The ICE-T lets users compare information for up to four DRGs at once, so let’s add some more DRGs to the chart. In this example, we’ll compare the total cost, the imaging cost, and the share of imaging cost for the DRG we’re interested in. Click on “Select DRGs to Compare”. Selection 1 shows the DRG we have already selected. The default selection for the chart is reporting information for Medicare Part A Total Cost for 2013. You can customize what information you want displayed. For example, we can change the year and data we want to use. Let’s select Part B data from 2010.
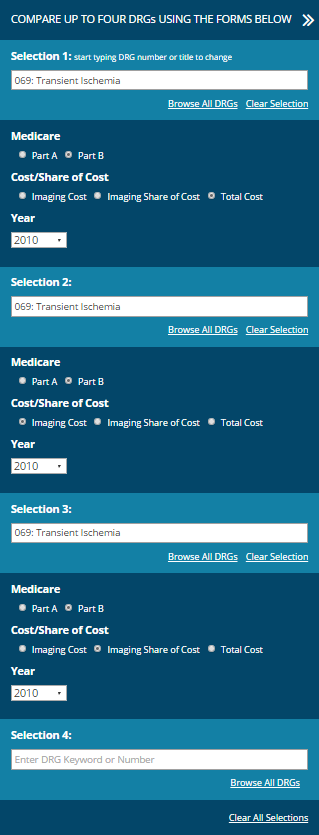
Let’s add two more DRG selections. In Selection 2, enter a DRG using the same method as on the front page of the ICE-T. We’ll use DRG 069 Medicare Part B Imaging Cost, also for 2010. Do this again for Selection 3 and choose “Imaging Share of Cost” for DRG 069 Medicare Part B for 2010.
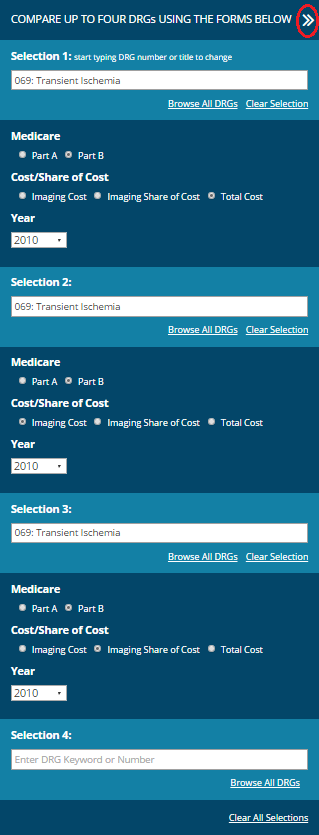
Finally, to see the results for the DRGs you are comparing, scroll to the top of the page and click the double arrow (“>>”) to the right of the “Compare Up to Four DRGs Using the Forms Below” title. If you would like to remove a selection, click the “Clear Selection” link under the DRG search box. To remove all selections, click the “Clear All Selections” at the very bottom of the “Compare Up to Four DRGs Using the Forms Below” box.
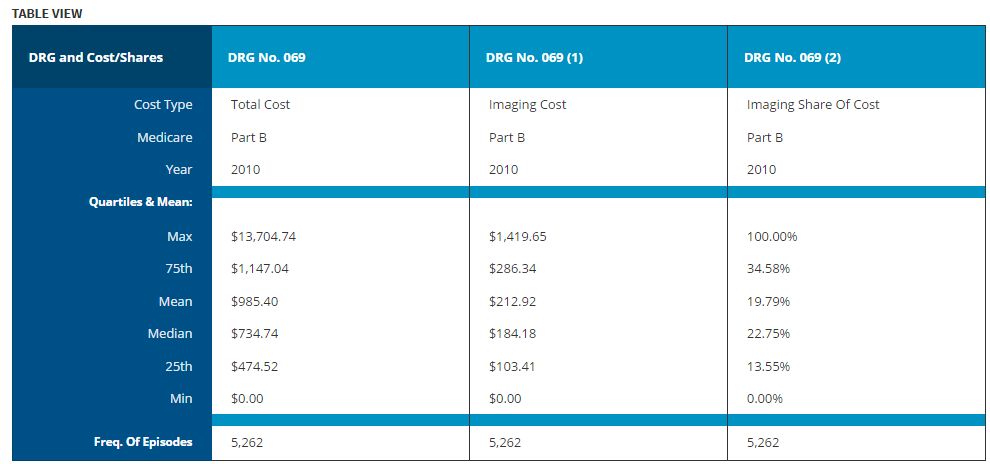
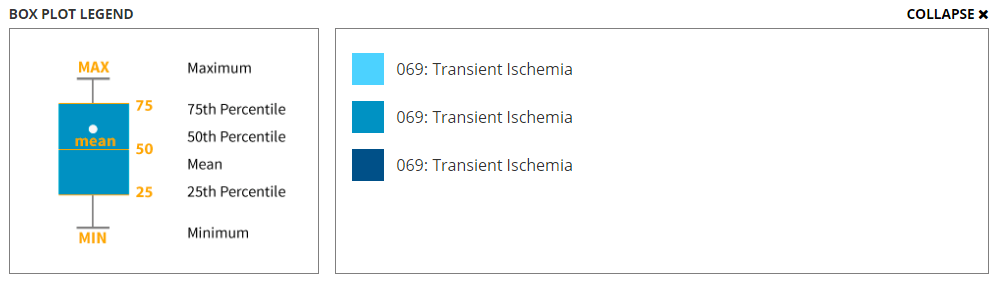
We can now compare the three DRG selections we made in the DRG Comparison chart. Hovering over the box for each DRG selection shows us the quartiles, frequency, and mean cost for that DRG.
![[C1] Compare Hover](http://www.neimanhpi.org/wp-content/uploads/2016/03/C1-Compare-Hover.png)
The legend below the box plot provides a description of the statistics included in the box plot, as well as the color codes associated with each of the DRG selections.
Scroll down to “Table View”. The Table View contains the numerical information associated with each DRG illustrated in the chart. The table provides a useful side-by-side comparison between the DRGs displayed above.