March 7, 2016
How Many Medicare Enrollees? CMS Methodological Changes and Implications for Research
In carrying out our mission—studying the role and value of radiology and radiologists in evolving healthcare delivery and payment systems—much of the work of the Neiman Health Policy Institute to date has focused on technology and service utilization diffusion. Without a firm and thorough understanding of where things stand today, it’s nearly impossible to prepare for the future. And so, we have strived whenever possible to help all imaging stakeholders define the reality of the present.
How much imaging is being performed? What kind? By whom? Where? And how is that all changing over time? These have been some of the questions our team has worked on with partners all across the country, and continues to answer in a variety of different journals. In our studies, we have largely focused on Medicare fee-for-service beneficiaries, because that’s a population of particular interest to policy makers at the federal level, and also because of several important logistical and operational reasons.
An increasing number of Medicare beneficiaries are covered by Medicare Advantage Plans, which are largely managed by private payers. Data for those individuals—as well as that for Medicaid beneficiaries and the large majority of Americans covered by non-governmental private payer plans—is far less accessible and far more fragmented. These challenges—along with the costs of obtaining and using such data resources—have resulted in many health policy research groups (like ours) focusing their work on the Medicare fee-for-service population.
To be able to assess real utilization in a population, one needs to know not only how many services were rendered, but also the covered beneficiary population at that time. As a general rule, for our work using the Centers for Medicare and Medicaid Services (CMS) Physician Supplier Procedure Summary Master File (PSPS-MF) aggregated claims data, we have reported utilization per 1,000 or 10,000 Medicare fee-for-service beneficiaries. In calculating utilization, extracted service counts represent the numerator, and Medicare enrollee counts represent the denominator.
Until recently, our team has used annual figures for supplemental medical insurance from the CMS Statistical Supplement to determine annual denominators dating back to 1994. CMS discontinued that reporting mechanism in 2013, and has now switched to CMS Program Statistics which provides enrollment figures back to 2008. Along with this new reporting venue, CMS has also changed the method by which it reports annual fee-for-service enrollment. Previously, CMS determined Part A and/or Part B enrollment based upon beneficiaries’ enrollment status in July of each year. Now, a person-year method is employed that accounts for both full year and partial year enrollment. The previous reported figures also rounded to the nearest thousand while the new reported figures provide actual counts. Because of these changes the new method produces slightly different values for the overlapping years:
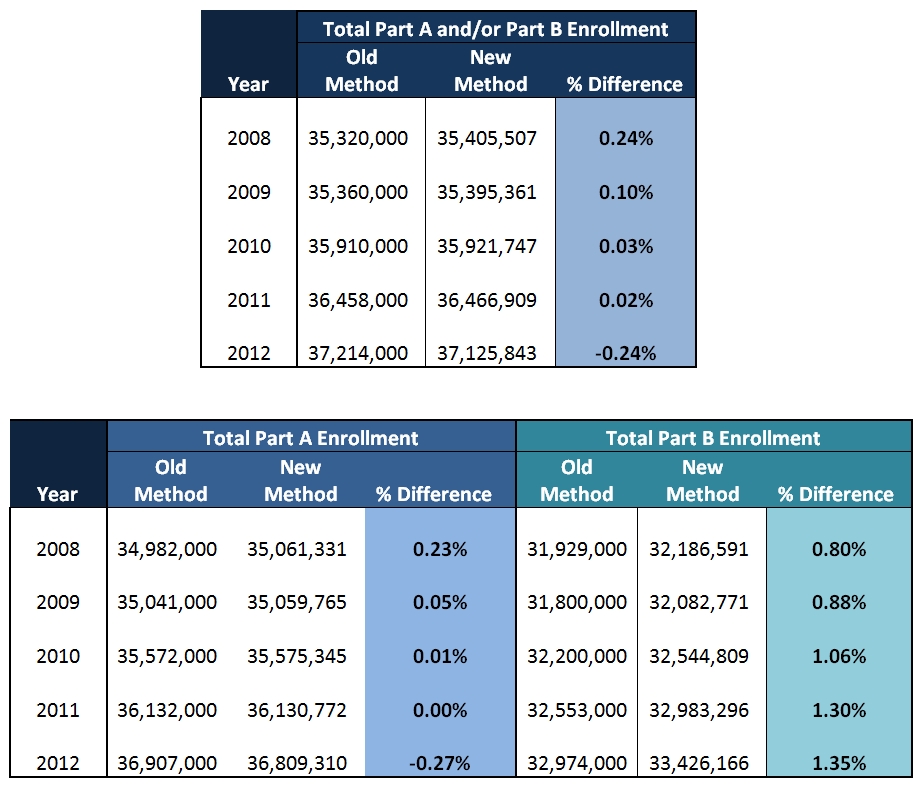
As illustrated, the number of Part A and Part B enrollees is very similar under both methods with a difference in total enrollment of around 1% between the two reporting alternatives. Since the new methodology does not go back far in time, our team is electing to use the older system for our PSPS-MF analyses of years up through 2007, and the newer system for analyses for years beginning in 2008. While the difference between methods appear negligible, it is important to remember that this deviation does exist when comparing enrollment figures prior to 2008 to figures afterwards. Adopting figures using the new method at its earliest point in 2008 will, we believe, ensure consistency in comparisons as more recent years are added to the data – which are usually the most pertinent for research and policy.
As we have previously commented, any meaningful interpretation of claims data analyses requires full transparency. That being said, it is often difficult to perform consistent and transparent analyses even when using the best data available. Echoing our previous warning, it is always important to understand the limitations of any data – even from the most reliable sources.